APPTWARE Lab
Advanced Reporting & Data Visualization Services
Apptware's data visualization services turn scattered spreadsheets and disconnected systems into dashboards a decision-maker can actually read at a glance, not a static export someone has to sit and interpret line by line. Our BI dashboard development work is built around the metrics your team actually watches, pulling live from every source that feeds them. Whether you need one Power BI dashboard or a full suite of interactive reporting solutions, we build it around your business, not a template.
PROVEN IMPACT
What clients see once we ship.
70%
Faster decision-making with real-time visual reporting
65%
Improvement in data interpretation through intuitive dashboards
50
Increase in operational efficiency by automating reporting workflowsncy
Trusted by enterprises
Building what's next


WHAT WE BUILD
Reporting capabilities, built around the metrics your teams actually watch
Our advanced reporting and visualization services can run end-to-end, from data aggregation to a fully automated dashboard suite, or plug into a BI platform you already have.
Real-Time Dashboards
Interactive, dynamic dashboards giving instant visibility into the metrics that matter, refreshed as the underlying data changes instead of on a fixed schedule.
Automated Report Generation
Scheduled reporting that eliminates manual data compilation, so nobody's building the same spreadsheet from scratch every Monday.
Custom Visualizations
Graphs, charts, and infographics tailored to what a specific audience needs to see, not a generic chart template stretched to fit every metric.
Trend & Pattern Visualization
Historical patterns surfaced clearly enough that trend shifts are visible at a glance, not buried in a table of numbers.
Multi-Source Data Integration
Databases, cloud platforms, and APIs connected into one reporting layer, so a dashboard doesn't require someone to stitch data together manually first.
Role-Based Data Access
Secure, customized reporting views for executives, analysts, and frontline teams, each seeing exactly what's relevant to their role.
Dashboards Built for Every Level
Executive dashboards that summarize company-wide performance, operational dashboards for day-to-day monitoring, and analytical dashboards for teams who need to dig into the raw numbers.
HOW WE WORK
Our advanced reporting and visualization process
Here's how a reporting and BI dashboard development engagement actually turns scattered spreadsheets into a dashboard suite people rely on, phase by phase.
Understanding Business Needs
The metrics that actually drive decisions get identified first, by role and by team, so the dashboards that follow are built around real reporting requirements, not a generic template of charts nobody asked for.
DELIVERABLES
- Key metrics and KPI inventory by stakeholder group
- Current-state reporting audit
- Defined dashboard audience and access model
- Data source inventory for each required metric
- Reporting cadence and refresh-rate requirements
- Prioritized dashboard build roadmap
Our Methodology
Why validation is non-negotiable for advanced reporting
A dashboard that looks polished but shows the wrong metric is worse than a plain spreadsheet, because it looks trustworthy while being wrong. Every advanced reporting and visualization engagement we run validates against the actual decisions a dashboard is meant to support before it's treated as done.

Validated Against Real Decisions, Not a Wishlist
Dashboards get built around the specific decisions stakeholders make, then tested against whether those decisions actually get easier.

Data Accuracy Audited, Not Assumed
The numbers feeding a dashboard get checked against source systems before launch, so a polished chart isn't built on a data error.

Audience Need First, Visual Polish Second
A dashboard that's visually impressive but doesn't answer the questions its audience actually asks gets reworked, not shipped as done.

Adoption Tracked Into the Timeline
Each optimization cycle closes with a look at whether the dashboard is actually being used, so unused reports get fixed or retired instead of quietly ignored.
PRODUCT ENGINEERING PRACTICE
Reporting systems, engineered to stay accurate after launch
Most of the risk in a reporting project isn't the first dashboard that looks great in the demo, it's whether the numbers still match the source system six months later, once upstream data has changed. Getting that wrong is expensive to fix once leadership has started making calls off a number that's quietly drifted.
Those calls get made deliberately, as part of the reporting architecture, not discovered after a number stops matching.

Reproducible Data Pipelines
Every metric's calculation logic is versioned, so a dashboard number's exact source isn't a mystery the first time someone questions it.

Visualization Standards
Chart types and color encoding follow consistent, accessible standards, so dashboards read clearly instead of each one reinventing its own visual language.

Documentation
Every metric definition and data source mapping is recorded, so the reasoning behind a number doesn't live in one analyst's head.

Data Drift Detection by Design
Monitoring for source-data changes that would affect dashboard accuracy is scoped in at build time, not added after a number has already gone stale.

Performance Benchmarking
Dashboards get load-tested against real concurrent users and data volumes, not a single-user demo environment.

Compliance Readiness
For regulated industries, access controls and audit requirements for sensitive reporting data get built in from the start, not discovered during a pre-launch review.
TECHNOLOGY STACK
Leading technologies behind our reporting and visualization builds
The stack isn't fixed. Data volume, audience size, and existing BI investment decide the tools, not a default template.
Power BI / Tableau / Looker
The dashboard and visualization layer, chosen by existing tooling, licensing, and audience familiarity.
Vercel or Node backenddbt / Airflow
Transformation and scheduling logic that keeps reporting data current and consistent.
App Store · Play StoreSnowflake / BigQuery
The data warehouse layer most dashboards query against for fast, consistent results.
AWS · Azure · GCPD3.js / Highcharts
Custom visualization libraries for dashboards that need something beyond a standard chart template.
Managed cloud or self-hostedNo vendor lock-in. You choose the stack. We build on standard, well-supported tools so any team can pick up where we leave off.
Cloud & DevOps
Testing & QA
CI/CD

THE ROI CASE
The business value delivered by advanced reporting and visualization services
The payoff doesn't show up in how the dashboard looks in a screenshot. It shows up in how much faster a team gets to a decision once they stop waiting on a manual report.

Faster decisions from real-time visibility instead of a weekly export

Fewer wasted hours rebuilding the same report by hand every cycle

Numbers your team actually trusts, because they match the source system

Trends and shifts visible before they turn into a real problem

Lower total cost than maintaining scattered spreadsheets

Dashboards people actually use, not ones built once and then ignored
Vertical Focus
High-impact real-time analytics across key industries
Some industries can wait for a next-day report. Healthcare, BFSI, and manufacturing usually can't, and that's who real-time analytics services like ours are built for.
Patient monitoring, watched as it happens
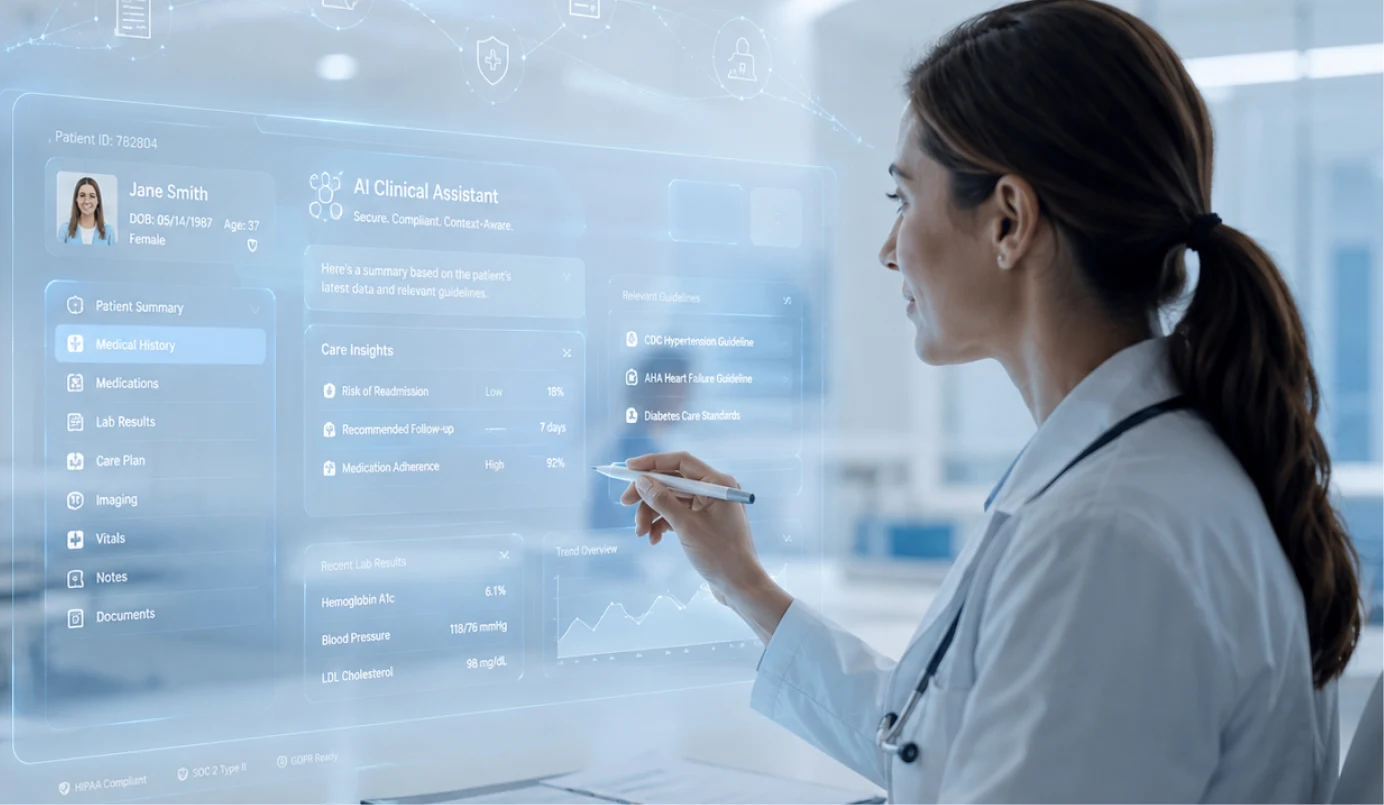
- Real-time vital sign monitoring and early deterioration alerts
- Live bed capacity and staffing dashboards for care teams
- Streaming equipment status monitoring for critical clinical devices
- Instant anomaly detection across patient monitoring data streams
Fraud and risk, caught in the moment
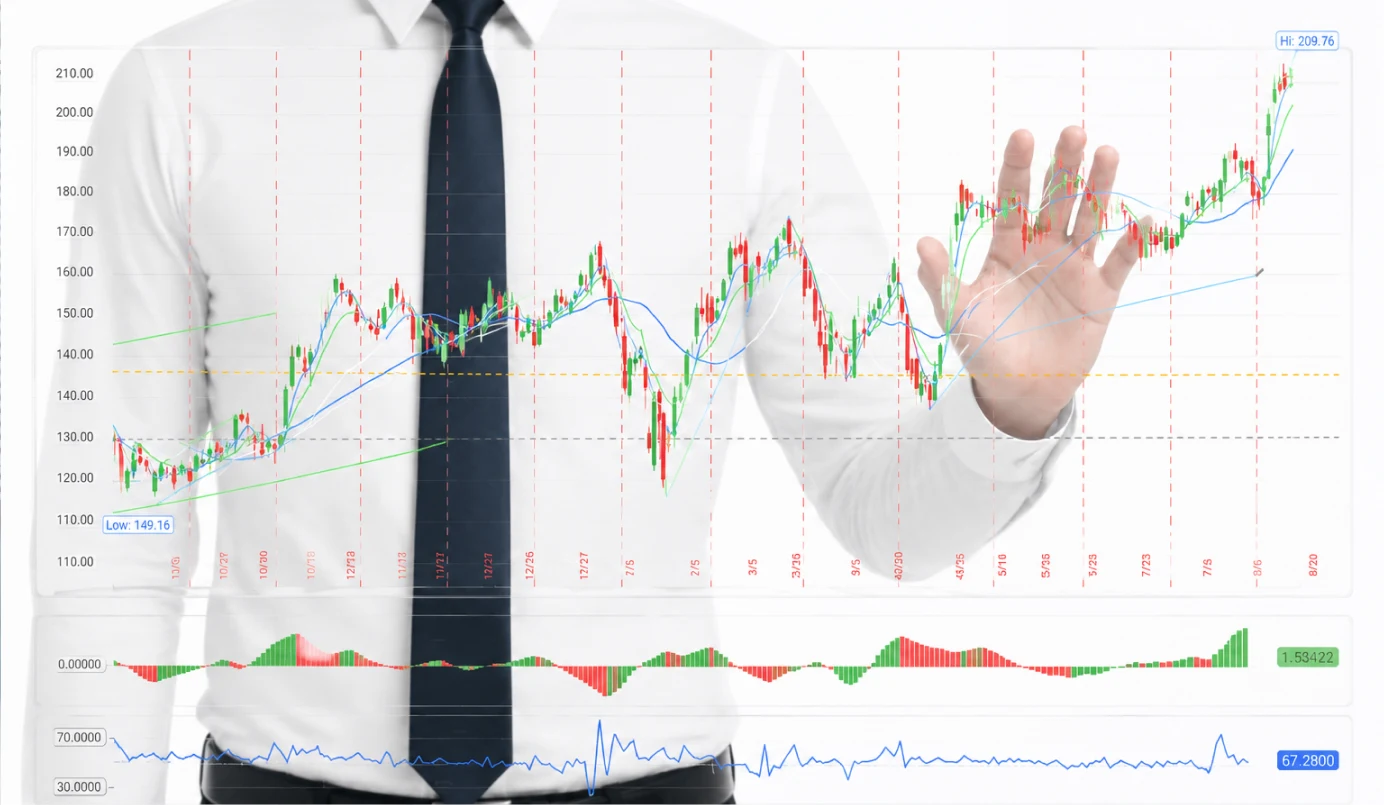
- Real-time transaction monitoring and fraud alerting
- Live market and portfolio risk dashboards for trading desks
- Streaming compliance monitoring across regulated transactions
- Instant anomaly detection across customer account activity
Fleet and production, tracked live

- Real-time vehicle diagnostics and fleet health alerting
- Live production line status dashboards across plants
- Streaming dealer and service demand monitoring
- Instant fault detection across connected vehicle sensors
Downtime, caught before it spreads

- Real-time equipment monitoring and failure alerting
- Live production yield and quality dashboards
- Streaming supply chain status monitoring across plants
- Instant anomaly detection across shop-floor sensor data
Field conditions, monitored as they change

- Real-time weather and field sensor monitoring
- Live irrigation and resource-use dashboards
- Streaming pest and disease outbreak alerting
- Instant anomaly detection across seasonal sensor networks
Demand, tracked as it shifts

- Real-time inventory and stockout alerting
- Live sales and traffic dashboards across channels
- Streaming fraud detection on payment transactions
- Instant anomaly detection across point-of-sale data
WHY US
What makes Apptware an advanced reporting and visualization partner
Plenty of teams can build a dashboard that looks good in a demo. What matters is whether the numbers still match reality months later, and that shows up in how the engagement is built, not just in the first demo.
01
Fixed-Scope Discovery
Whether you engage us for a single dashboard or a full reporting suite, the discovery phase is scoped upfront, what gets evaluated, how long it takes, and what you'll have in hand at the end.
02
Working Dashboard, Fast
You'll have a working dashboard built against your own data within the first few weeks, not a mockup describing what reporting might eventually look like.
03
Validation at Every Phase
Feedback from one phase shapes the scope of the next. If early stakeholder feedback changes the plan, the roadmap changes with it, mid-project, not just at a single review gate.

Apptware Solutions' work helped the client improve their time-to-market. The team retained all core resources throughout the contract. Apptware Solutions assigned a project manager to oversee the tasks and timelines. The team was proactive in communicating and responding to the client.




Get Started
Ready to stop building
the same report by hand?
Tell us which report takes too long to put together. Whether you need a single dashboard or a full reporting suite, we'll run the data feasibility check, map out the build and timeline, and give you a real cost estimate before any development work starts.
 No-cost discovery audit
 100% IP ownership
 No commitment required
 US & India presence
FAQ'S
Straight answers to what prospective clients ask most before committing to a discovery phase.
Data quality is about whether the data itself is accurate and clean. Data governance is the policies and controls that keep it that way, and keep access to it appropriate, over time. Most engagements address both together.
Still building next quarter's report the same way?
Need expert guidance on turning scattered data into a dashboard people actually trust? Spend 45 minutes with our data engineering team. They'll audit your current reporting process, benchmark what a dashboard build would take, and return a roadmap with timeline and cost, within 5 business days, no commitment.
 USA
 INDIA



Got a similar challenge?
Have a product idea you're trying to validate?
Let's talk about what Apptware can build for you.