APPTWARE Lab
Real-Time Analytics Services
Apptware builds real-time data analytics systems that process live data streams the moment they arrive, not on the next scheduled batch run. Operational signals, anomaly alerts, and live data analytics dashboards get engineered around the decisions your team actually needs to make in the moment, deployed against the data stack you already run.Apptware builds real-time analytics systems that process live data streams the moment they arrive, not on the next scheduled batch run.
PROVEN IMPACT
What clients see once we ship.
70%
Faster decision-making with real-time analytics
50%
Reduction in operational risk through early anomaly detection
50%
Reduction in latency for real-time analytics workloads
Trusted by enterprises
Building what's next


WHAT WE BUILD
Real-time analytics capabilities, built around your live data
Our real-time analytics services can run end-to-end, from streaming ingestion to a live operational dashboard, or plug into a data platform you already have.
Live Data Processing
Analyze and visualize data streams the moment they land, so decisions run on what's happening right now, not what happened last night.
Streaming Data Integration
Every live source your business runs, sensors, transactions, application events, connected into one processing pipeline instead of a dozen point feeds.
Event-Driven Analytics
Automated responses triggered the instant a defined condition fires, so operational actions happen without someone watching a dashboard around the clock.
Real-Time Anomaly Detection
Deviations from expected patterns get flagged as they happen, so operational and fraud risks get caught before they become incidents.
Cloud-Based Analytics
Scalable, real-time platforms built for global data accessibility, so teams in any location see the same live picture.
Data Visualization & Reporting
Interactive dashboards built for instant interpretation, not a static export someone has to refresh manually.
Real-Time Business Intelligence
Interactive dashboards built for instant interpretation, not a static export someone has to refresh manually.
HOW WE WORK
Our real-time analytics process
Here's how a real-time analytics engagement actually turns live data into instant, actionable signals, phase by phase.
Data Collection & Integration
This phase captures and integrates structured and unstructured live data from every source that actually matters to the decision, so the pipeline processes a complete picture instead of whatever feed happened to be easiest to connect.
DELIVERABLES
- Live data source audit and streaming integration map
- Structured and unstructured streaming pipelines
- Data latency and throughput baseline report
- Defined operational thresholds and alert conditions
- Live data feed connections across every source in scope
- Defined success metrics for decision speed
Our Methodology
Why validation is non-negotiable for real-time analytics
A real-time dashboard is only useful if the data behind it is actually current and the alerts behind it are actually accurate. Every real-time analytics engagement we run tests both before a system goes live, because a live-looking dashboard built on stale or noisy data is worse than no dashboard at all.

Validated Against Real Operational Data, Not a Demo Feed
Latency and accuracy get measured against real production data streams, so results reflect what happens once the system is live, not how it performs on a clean sample.

Alert Fatigue Audited, Not Ignored
Thresholds get tuned to catch real anomalies without flooding teams with false positives, so alerts stay trusted instead of getting muted.

Business Decision First, Latency Metric Second
A pipeline that hits an impressive latency number but doesn't deliver the signal a decision actually needs gets reworked, not shipped as done.

Tuning Built Into the Timeline
Each monitoring cycle closes with a decision on whether to retune thresholds, so accuracy holds up as real-world patterns shift under it.
DATA ENGINEERING PRACTICE
Real-time pipelines, engineered to stay accurate after launch
Most of the risk in a real-time analytics project isn't the first alert that fires correctly, it's whether the thresholds still make sense six months later, once data patterns have shifted. Getting that wrong is expensive to fix once a team has started ignoring alerts they no longer trust.
You're not locked into our team to maintain what we build. Every stack choice uses standard, widely-supported tools.

Reproducible Data Pipelines
Reproducible Pipelines: Every streaming job is versioned and reproducible, so an alert's exact trigger logic isn't lost the first time someone asks why it fired, or didn't.

Visualization Standards
Alert Accuracy Standards: False-positive and false-negative rates get tracked over time, so alert thresholds get corrected before they're ignored.

Documentation
Documentation: Every trigger, threshold, and pipeline decision is recorded, so the reasoning behind an alert doesn't live in one engineer's head.

Data Drift Detection by Design
Latency Monitoring by Design: End-to-end latency tracking is scoped in at deployment, not added after teams start noticing dashboards running behind.

Performance Benchmarking
Performance Benchmarking: Pipelines get load-tested against real event volumes and peak-traffic conditions, not a demo-scale sample.

Compliance Readiness
Compliance Readiness: For regulated industries, audit trail requirements for automated alerts get built into the pipeline from the start, not discovered during a pre-launch review.
TECHNOLOGY STACK
Leading technologies behind our real-time analytics
The stack isn't fixed. Event volume, latency requirements, and where the pipeline needs to run decide the tools, not a default template.
Apache Kafka / Flink
Streaming ingestion and processing, the core of most real-time pipelines in this practice.
Low-latency, event-drivenRedis / Elasticsearch
Fast-access storage for the low-latency lookups real-time dashboards depend on.
In-memory or indexedApache Spark Streaming
Micro-batch and streaming analytics for workloads that sit between pure batch and pure real-time.
Cluster-basedPower BI / Grafana
Live dashboards and visualization layers built for instant interpretation.
Real-time refreshNo vendor lock-in. You choose the stack. We build on standard, well-supported tools so any team can pick up where we leave off.
Cloud & DevOps
Testing & QA
CI/CD

THE ROI CASE
The business value delivered by real-time analytics services
The payoff doesn't show up in how fast the pipeline processes an event. It shows up in what clients tell us once decisions stop waiting on yesterday's data.

Faster operational decisions made on current, not stale, data

Reduced losses from earlier anomaly and risk detection

Fewer resources wasted reacting to problems discovered too late

Lower total cost of ownership than manual, dashboard-watching monitoring

Live visibility shared clearly across stakeholders and locations

Continuous improvement as more live data accumulates
Automated responses freeing teams from round-the-clock monitoring
Vertical Focus
High-impact real-time analytics across key industries
Some industries can wait for a next-day report. Healthcare, BFSI, and manufacturing usually can't, and that's who real-time analytics services like ours are built for.
Clinical and operational dashboards, built for care teams
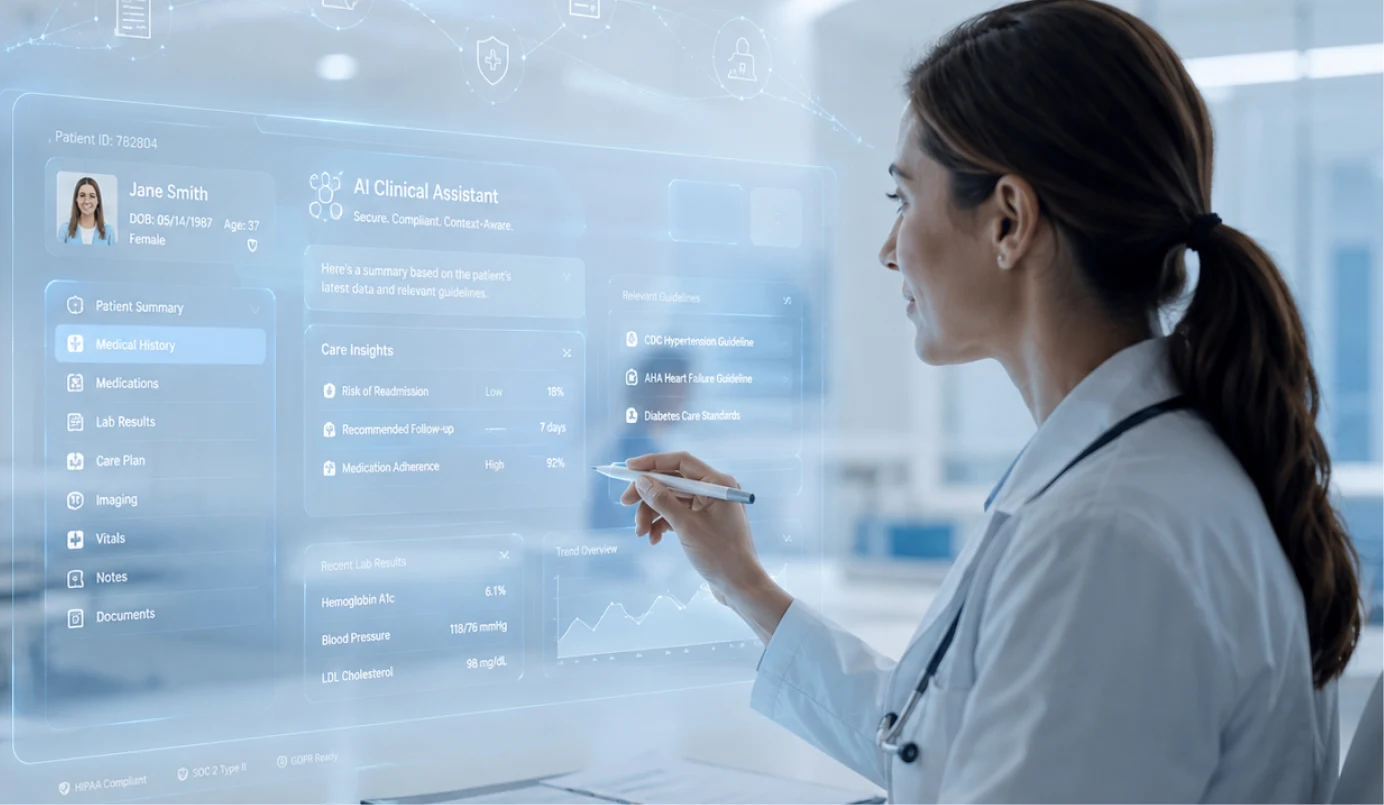
- Real-time bed capacity and staffing dashboards
- Patient outcome and readmission reporting for clinical leadership
- HIPAA-compliant, role-based dashboard access
- Automated compliance and quality-metric reporting
Risk and performance dashboards, built for scrutiny
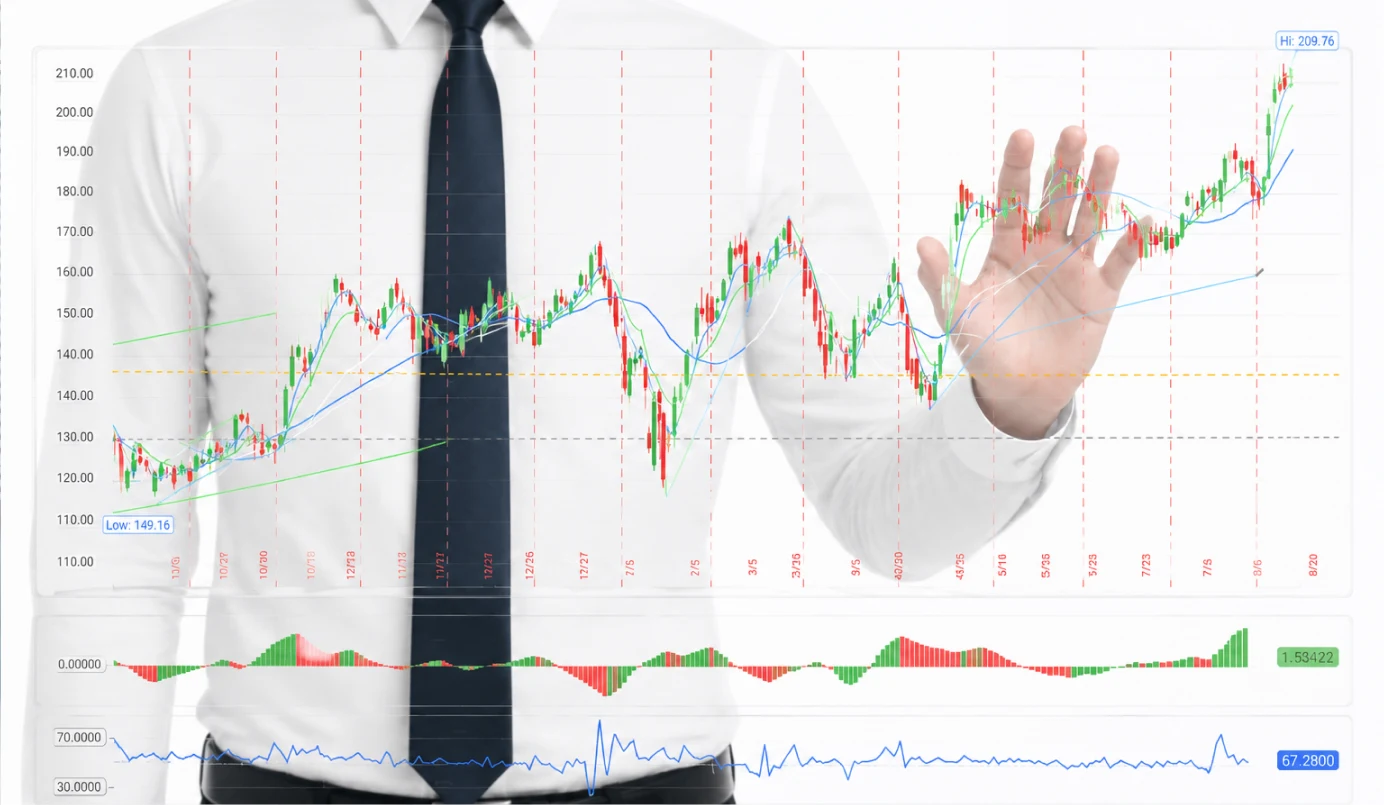
- Real-time portfolio and risk dashboards for investment teams
- Automated regulatory reporting with full audit trails
- Fraud and transaction monitoring visualizations
- Role-based dashboards across branches and business units
Fleet and dealer dashboards, built for the network

- Fleet performance and maintenance dashboards
- Dealer network sales and inventory reporting
- Warranty and service trend visualizations
- Cross-dealer benchmarking dashboards
Production dashboards, built for the shop floor

- Real-time production yield and quality dashboards
- Downtime and maintenance trend reporting
- Supply chain visibility dashboards across plants
- Automated compliance and safety reporting
Field dashboards, built for the growing season

- Real-time field condition and yield dashboards
- Weather and resource-use trend visualizations
- Seasonal performance reporting across regions
- Automated reporting for agricultural compliance requirements
Sales dashboards, built down to the SKU level

- Real-time sales and inventory dashboards across channels
- Customer behavior and demand trend visualizations
- Automated performance reporting by store and region
- Role-based dashboards for store, regional, and executive teams
WHY US
What makes Apptware an advanced reporting and visualization partner
Plenty of teams can build a dashboard that updates quickly. What matters is whether the alerts stay accurate and trusted months in, and that shows up in how the engagement is built, not just in the first demo.
01
Fixed-Scope Discovery
Whether you engage us for a single dashboard or a full reporting suite, the discovery phase is scoped upfront, what gets evaluated, how long it takes, and what you'll have in hand at the end.
02
Working Dashboard, Fast
You'll have a working dashboard built against your own data within the first few weeks, not a mockup describing what the reporting might eventually look like.
03
Validation at Every Phase
Feedback from one phase shapes the scope of the next. If early stakeholder feedback changes the plan, the roadmap changes with it, mid-project, not just at a single review gate.
04
Support After Launch
A deployed real-time system still needs monitoring, threshold tuning, and a plan for what gets built next. Our team stays on to track accuracy and ship the improvements the data points to.

Apptware Solutions' work helped the client improve their time-to-market. The team retained all core resources throughout the contract. Apptware Solutions assigned a project manager to oversee the tasks and timelines. The team was proactive in communicating and responding to the client.




Get Started
Ready to see what's happening
as it happens?
Tell us what you're finding out about too late. Whether you need our full real-time analytics services or a single streaming pipeline to validate an approach first, we'll run the data feasibility check, map out the pipeline and deployment timeline, and give you a real cost estimate before any development work starts.
 No-cost discovery audit
 100% IP ownership
 No commitment required
 US & India presence
FAQ'S
Straight answers to what prospective clients ask most before committing to a discovery phase.
A static report is a snapshot, accurate the moment it was pulled and stale after. A dashboard connects live to source data, so it stays current without anyone rebuilding it.
Need expert guidance on turning live data into decisions you can act on instantly?
Spend 45 minutes with our data engineering team. They'll audit your current data latency, benchmark what a real-time pipeline would need to hit your target response time, and return a roadmap with timeline and cost, within 5 business days, no commitment.
 USA
 INDIA



Got a similar challenge?
Have a product idea you're trying to validate?
Let's talk about what Apptware can build for you.